Hello, I am Khushi Shetty
Passionate data enthusiast skilled in uncovering insights and presenting them in clear, compelling ways for non-technical audiences. Excels in big data exploration and machine learning, always eager to learn and adapt to new technologies. Sees data as a playground for innovation and enjoys predicting trends and discovering correlations.
About Me

Hello! With a profound passion for data and transformative technology, I have honed a comprehensive skill set that includes advanced proficiency in Python, SQL, and R, supplemented by certifications in AWS and Microsoft Excel. My education at Syracuse University, where I completed a Master of Science in Information Systems and a Certificate of Advanced Study in Data Science, has equipped me for complex data analysis, visualization, and cloud-based solutions. I am adept at using platforms such as Tableau, Power BI, and Databricks, facilitating the deployment of sophisticated, cloud-enabled analytical tools. Currently, I am looking for opportunities to leverage my skills in practical applications, particularly in data analytics and cloud engineering, aiming to collaborate with industry professionals and contribute to innovative projects.
My Timeline 💫
Data Engineer
iConsult, Syracuse University
Jan 2024 - PresentStudent
Syracuse University
Masters of Science in Information Systems
Aug 2022 - May 2024Data Science and Analytics Intern
Autowebbed Technologies
Jun 2021 - Dec 2021Student
Mumbai University
Bachelor of Engineering in Electronics and Telecommunications
Aug 2018 - May 2022Skills
Python
R
SQL
Snowflake
Tableau
Power BI
Microsoft Excel
Amazon Web Service
Microsoft Azure
Databricks
Alteryx
Apache Airflow
Visualizations

Spotify Personal Playback Dashboard
The image showcases a Spotify Personal Playback Dashboard, designed to analyze music preferences. It features sections including "Top 5 Tracks by Popularity," "Playlist Analysis" for a 'Party' playlist, genre distribution pie chart, release date heat map, and audio features bar graphs for different moods. The dashboard uses Spotify’s green and black colors, providing a detailed and visually appealing insight into listening trends.
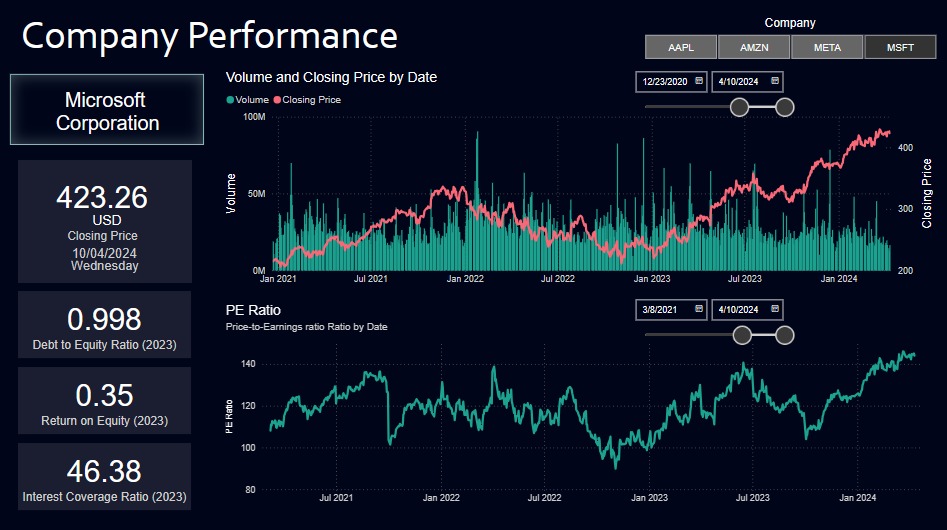
Comprehensive Financial Dashboard
This dashboard offers a concise overview of financial market trends and company performances, highlighting closing prices of indices like the Wilshire 5000, Dow Jones, and NASDAQ over a decade. It includes sector breakdowns for the S&P 500 and NASDAQ, emphasizing Information Technology and Health Care, and details individual metrics for companies like Microsoft and Amazon, such as closing prices, volume, and financials. This visualization combines historical data and current metrics to aid strategic investment decisions.
Projects

Automated Stock Data Management
This project harnesses Python and Alteryx for efficient data wrangling, coupled with a cloud-based ELT pipeline via Azure Functions, Logic Apps, and Azure Synapse Analytics for streamlined stock data handling. This setup automates data extraction, and transformation, and updates notifications, while Synapse Pipelines facilitate data refreshes and resource optimization.

Video Game Analysis
This project analyzes a rich dataset of video game sales, leveraging R to clean, process, and visualize the data to uncover industry trends and preferences across different regions and platforms. Through targeted visualizations like bar graphs, pie charts, and scatter plots, we explore global sales distribution, the relationship between critic and user scores, and the impact of genres and platforms on market performance. This concise analysis offers insights into regional sales preferences and the evolving video game industry landscape, providing valuable information for stakeholders and enthusiasts looking to understand the drivers of video game success.

Exploring Spotify with Natural Language Processing
This project delves into user preferences, playlist creation, and track patterns to enrich music enjoyment. By uncovering insights, we aim to enhance the user experience and offer tailored recommendations, ultimately contributing to the dynamic landscape of digital music consumption.

Analyzing NYC Green Taxi Trips
A study on NYC Green Taxi Trip Data (Jan 2022 - Jan 2023) uses machine learning to predict fares and find profitable pickup spots, extending service beyond Manhattan and airports. This aims to optimize earnings for drivers and improve service quality for passengers, enhancing efficiency in the taxi industry.

PowerSC
PowerSC aims to tackle the challenge of managing electricity demand in South Carolina and nearby areas during peak summer months, focusing on preventing blackouts without building new infrastructure. By analyzing detailed house data, hourly energy usage, and weather patterns, the project seeks to understand consumption drivers and promote energy conservation among customers, aligning operational efficiency with environmental sustainability.
Get in Touch
+1 3153171808